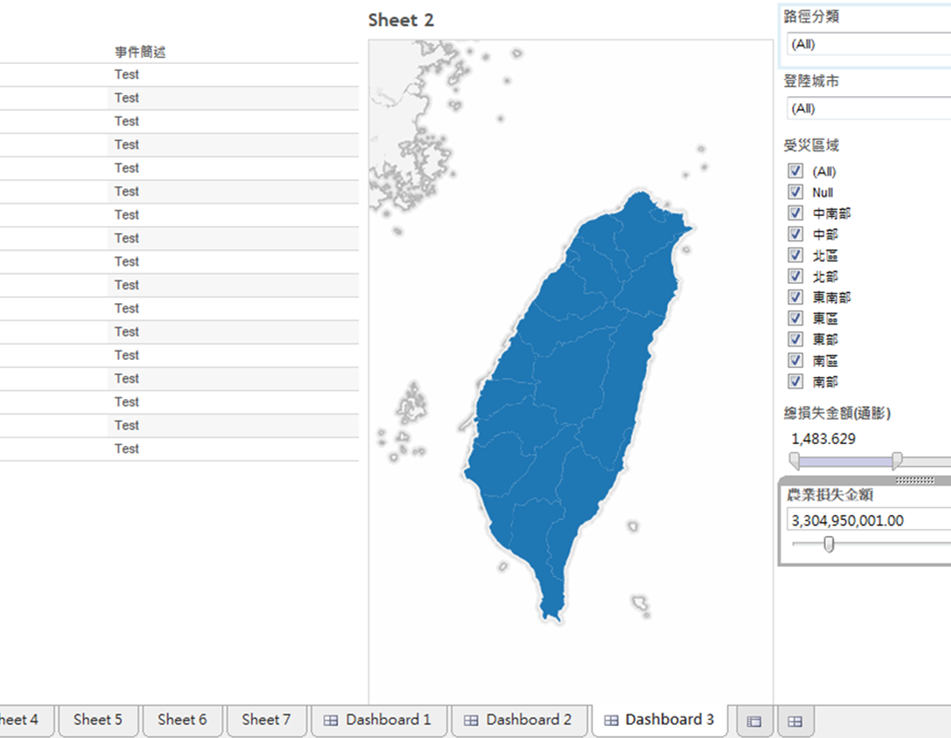
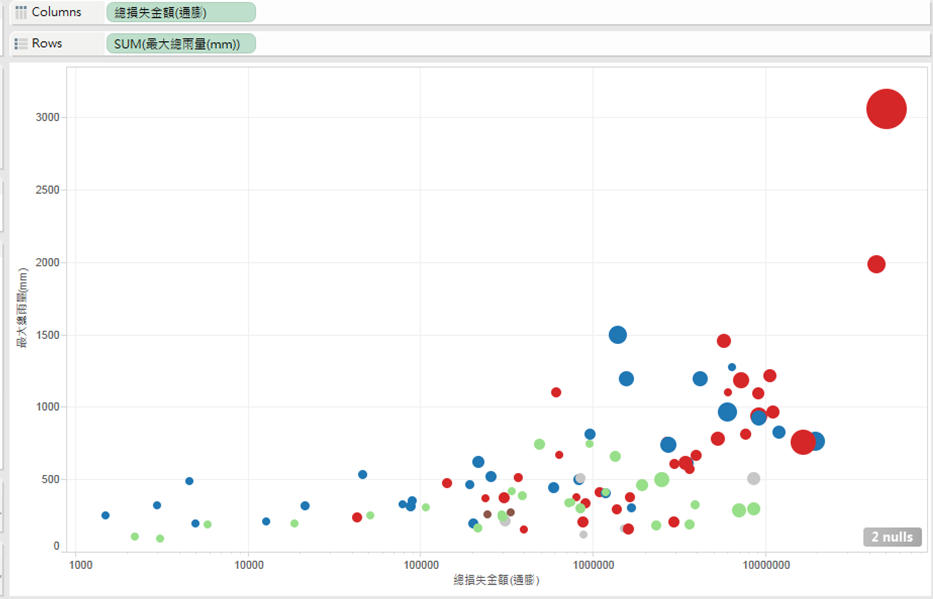
摘要每逢夏秋之際,台灣受風災影響甚鉅,平均每年受到約三至四個颱風侵襲,近年來又因氣候變遷造成雨旱季雨量分布不均,嚴重影響供水,亦增加氣象預測的困難性。由於天災的複雜性與其難以預測,我們選擇以「經驗學習」之方式來協助災害管理,並透過資料視覺化提升使用效率。藉由歷年水利災害事件相關之大氣資料、災情資訊與應變處置紀錄,試圖在災害來臨前探索與過去災害之關聯性,以協助防災決策,防備未然。本研究共分為短期研判與長期趨勢兩大部分:前者依據颱風路徑、登陸城市和受災地區等屬性分類,以檢索方式篩選較具關連性之災害事件。篩選過後,再由所蒐集的災害相關文件與自建防災語料庫所產生之文字雲來呈現災害關鍵訊息。後者則以歷年颱風統計資料(如總損失金額、最大降雨量等)之呈現散佈情形,並可動態展示歷年災害趨勢。目前文字雲在蒐集相關災害事件文件上仍採人工搜索方式,而所建立之防災語料庫亦尚未完備,需經更多災害事件之驗證來充實詞彙量。
AbstractTaiwan, hit by about 3 to 4 typhoons annually, is assessed one of the most dangerous place in the world. Besides, the global climate shift affects the environment, enlarging the gap between rain season and dry season. Due to the complexity and unpredictability of natural disasters, we adopt the “Lesson Learned” mechanism, a method for people to learn from past experiences rather than any fixed rules, and present data via visualization techniques. By atmospheric data in annual hydrological
incidents, disaster information,and record of disposal, to make the connection between the past disasters and
the coming disaster which help government to make decisions. The research divides into two part: short term and long term. The former uses the route of the typhoon, landing city and disaster-affected districts to filter out the most relevant typhoon in history. Then, according to history reports and the dictionary built by disaster word list to generate "word clouds" and show the key words of disaster. The latter uses the annual statistical data such as money loss and max precipitation to dynamically display the distribution and the trend. In the present, the raw data generate word list still using manual search, and the dictionary of disaster is not yet complete, there still need more disaster events to enrich the word list. |

|
